
Mesothelioma deaths by area: Britain’s asbestos legacy
Explore mesothelioma mortality across 350 council areas. Compare men and women, look at the long-term picture and see how each area’s figures have changed.
Find your area- Council areas covered
- 350England, Scotland and Wales
- Recorded mesothelioma deaths
- 75,1511981–2024; men and women
- Local trends
- 8 periods1985–1989 to 2020–2024
A legacy that looks different from place to place
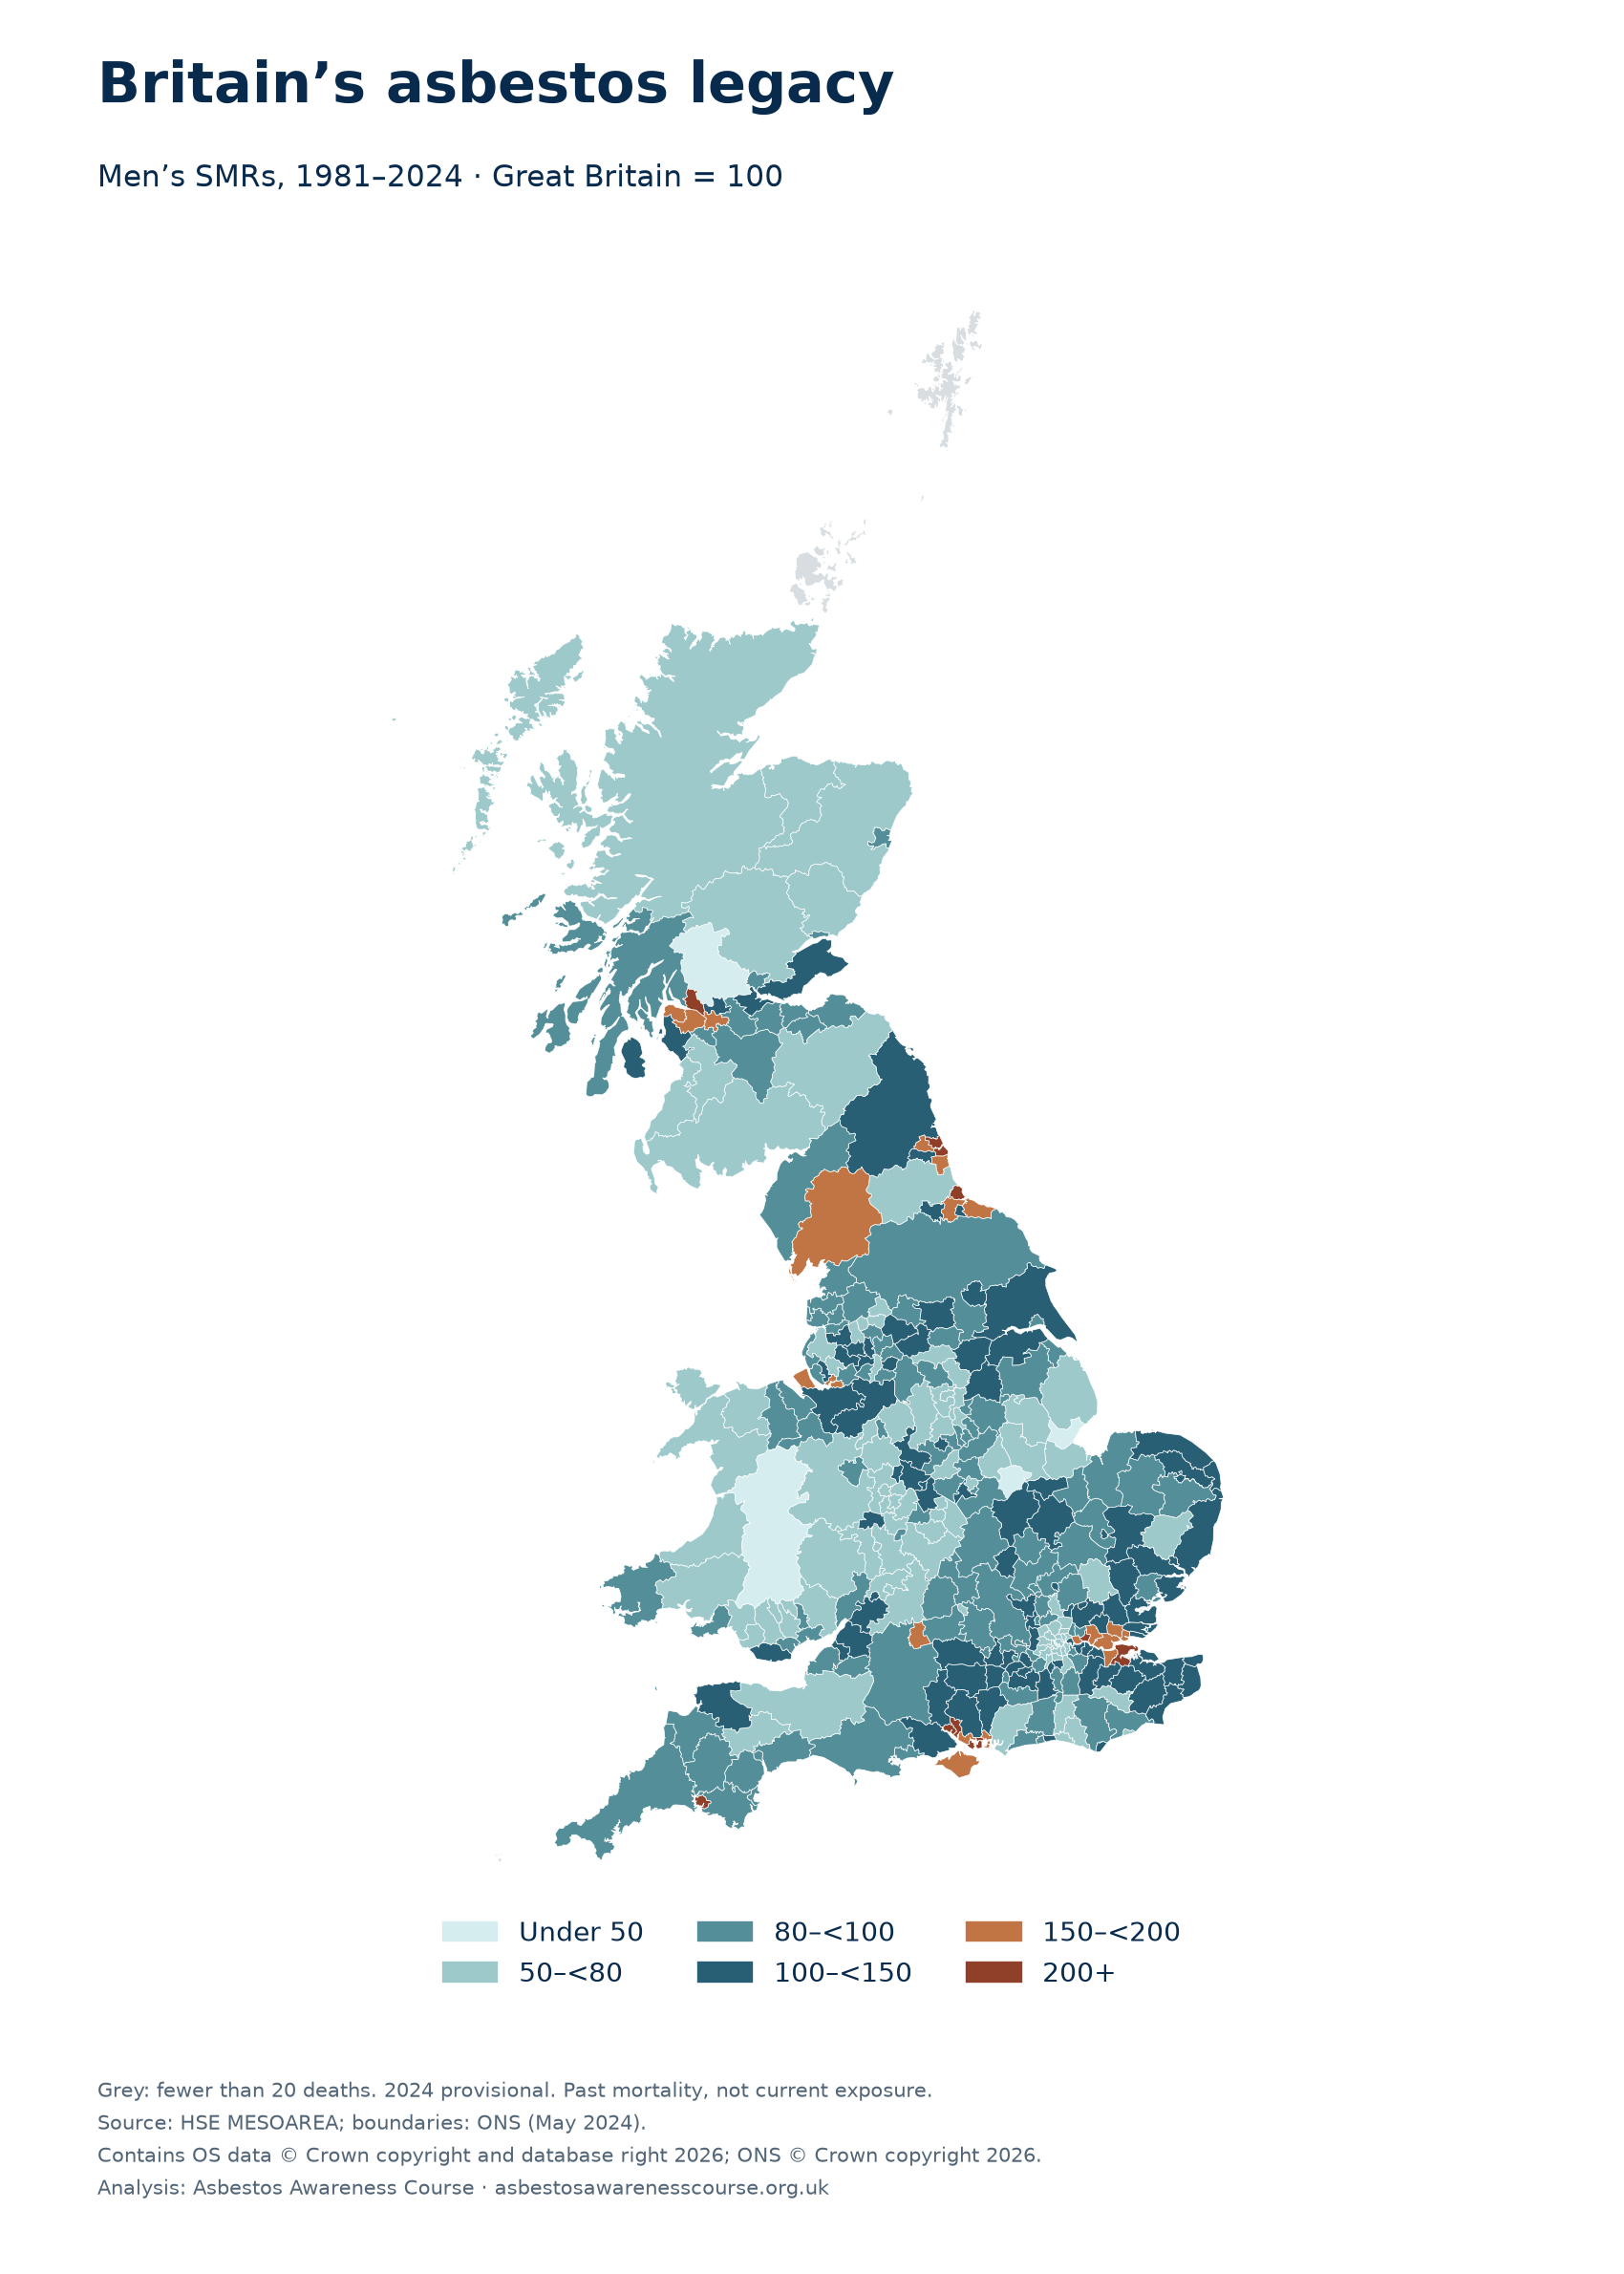
West Dunbartonshire recorded the highest long-term male mesothelioma ratio among areas meeting this study’s minimum-count rule. Its standardised mortality ratio (SMR) of 337.1 means 3.37 times the deaths expected if the area had experienced Great Britain’s age-specific male mortality rates over 1981–2024. There were 308 recorded male deaths.
South Tyneside and North Tyneside followed, at 272.5 and 271.9. Their estimates are very close and their confidence intervals overlap. Numerical rank alone does not establish a meaningful difference between areas.
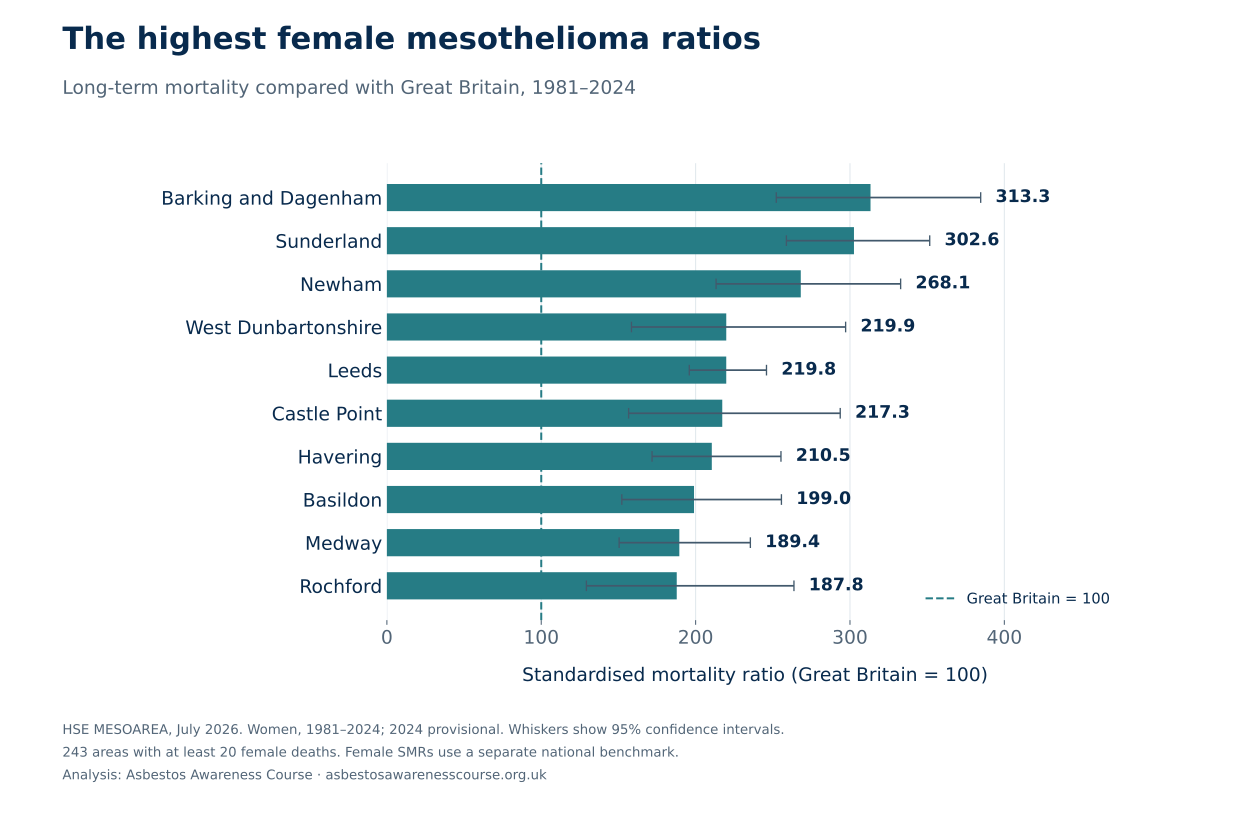
For women, Barking and Dagenham had the highest ratio, at 313.3, followed by Sunderland at 302.6 and Newham at 268.1. The male and female tables have their own national benchmarks and must be read separately.
At the lower end, Powys had a male SMR of 40.5, followed by Rutland at 44.3 and Stirling at 47.9, among areas with at least 20 male deaths. The lowest eligible female ratio was in Barnsley, at 45.9.
The ten highest male ratios
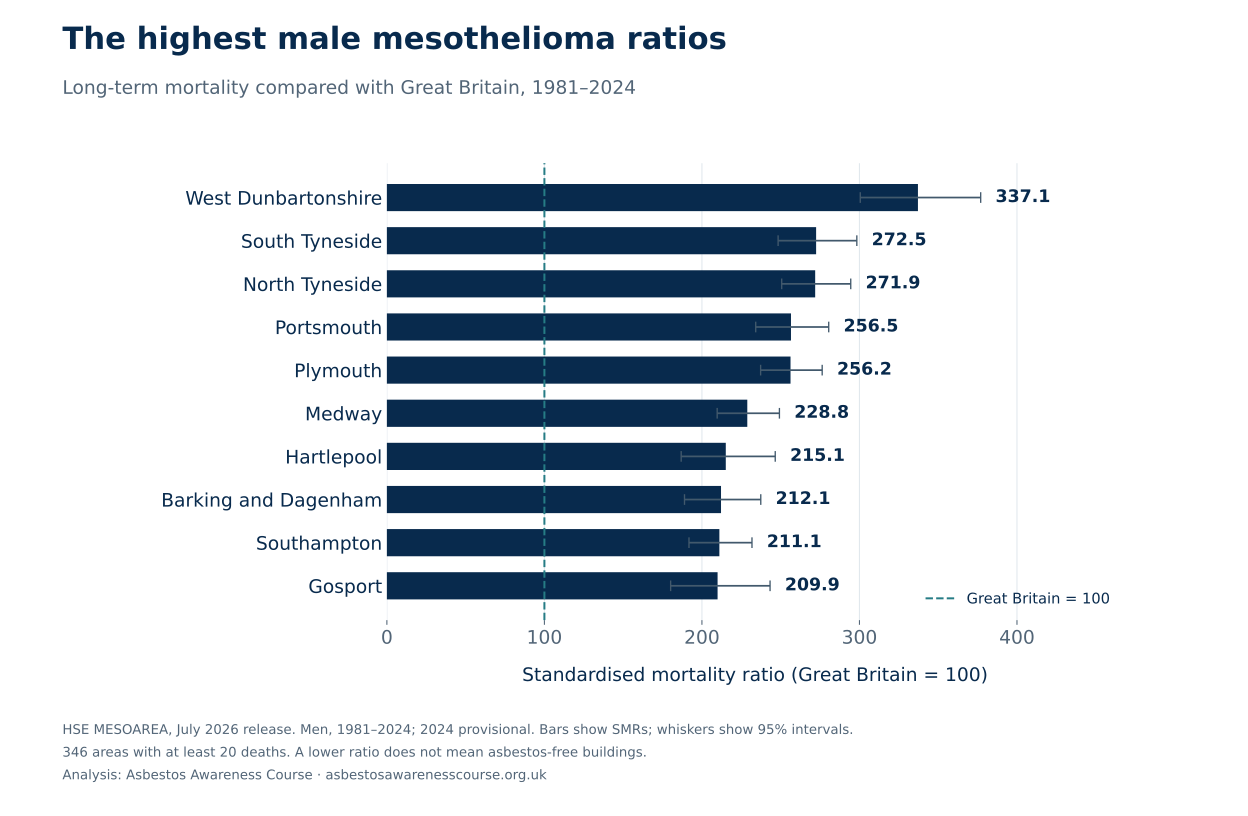
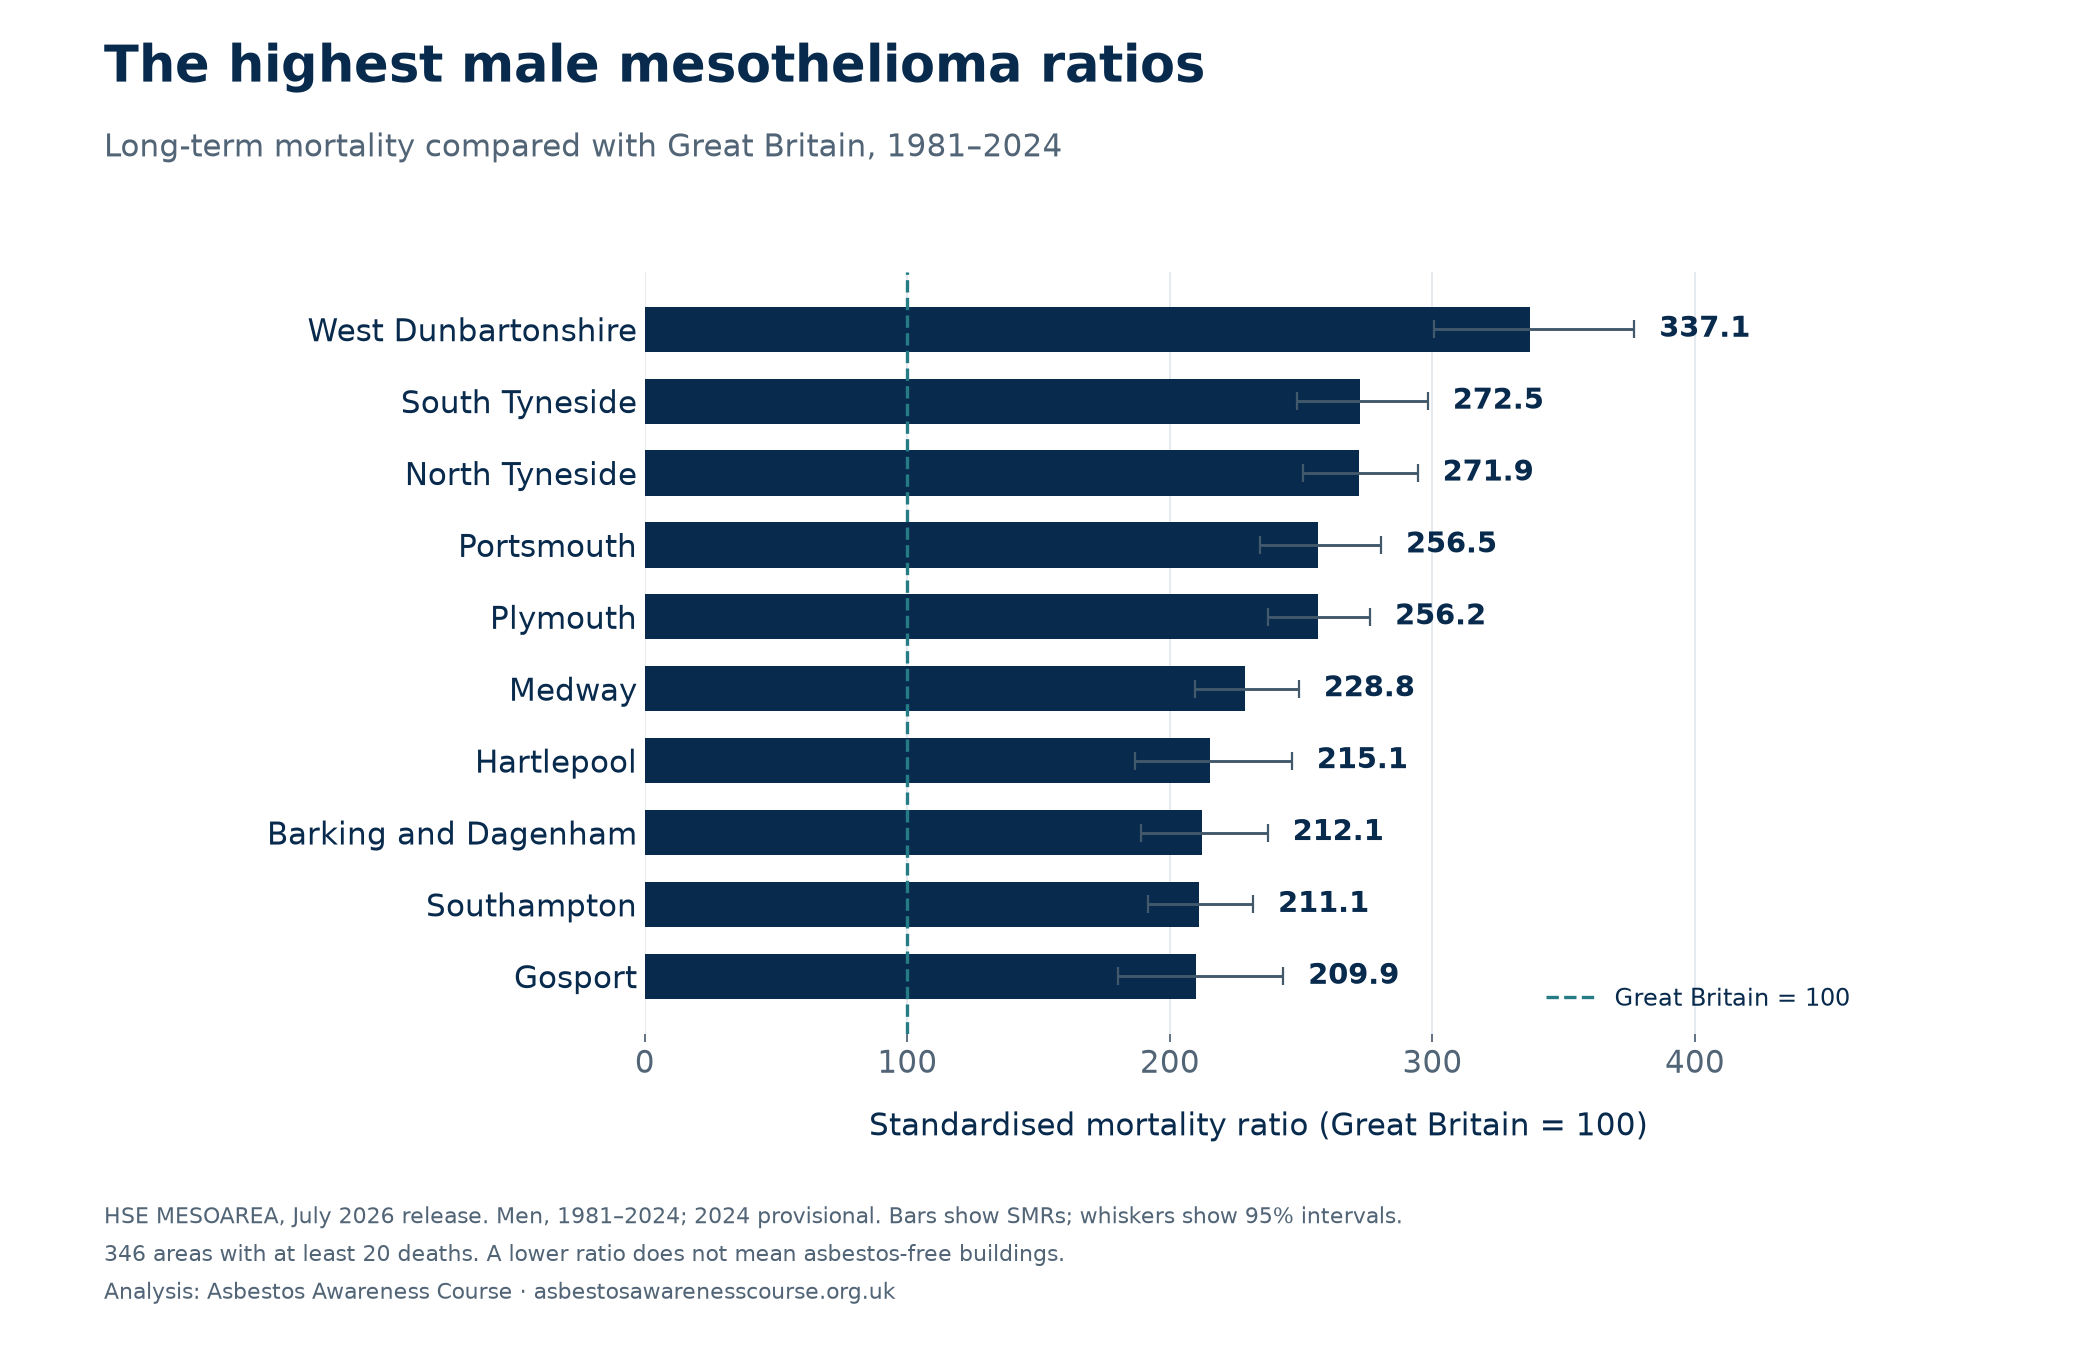
The ten lowest male ratios
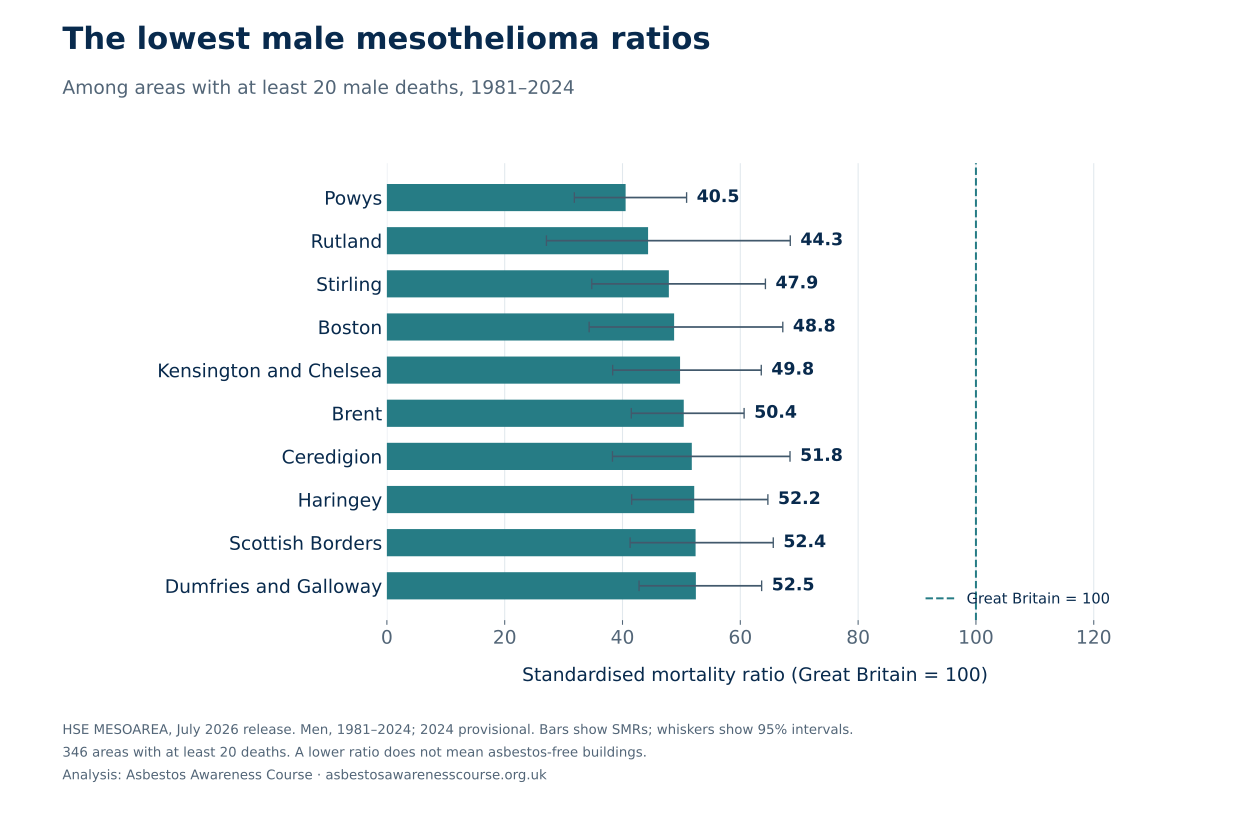
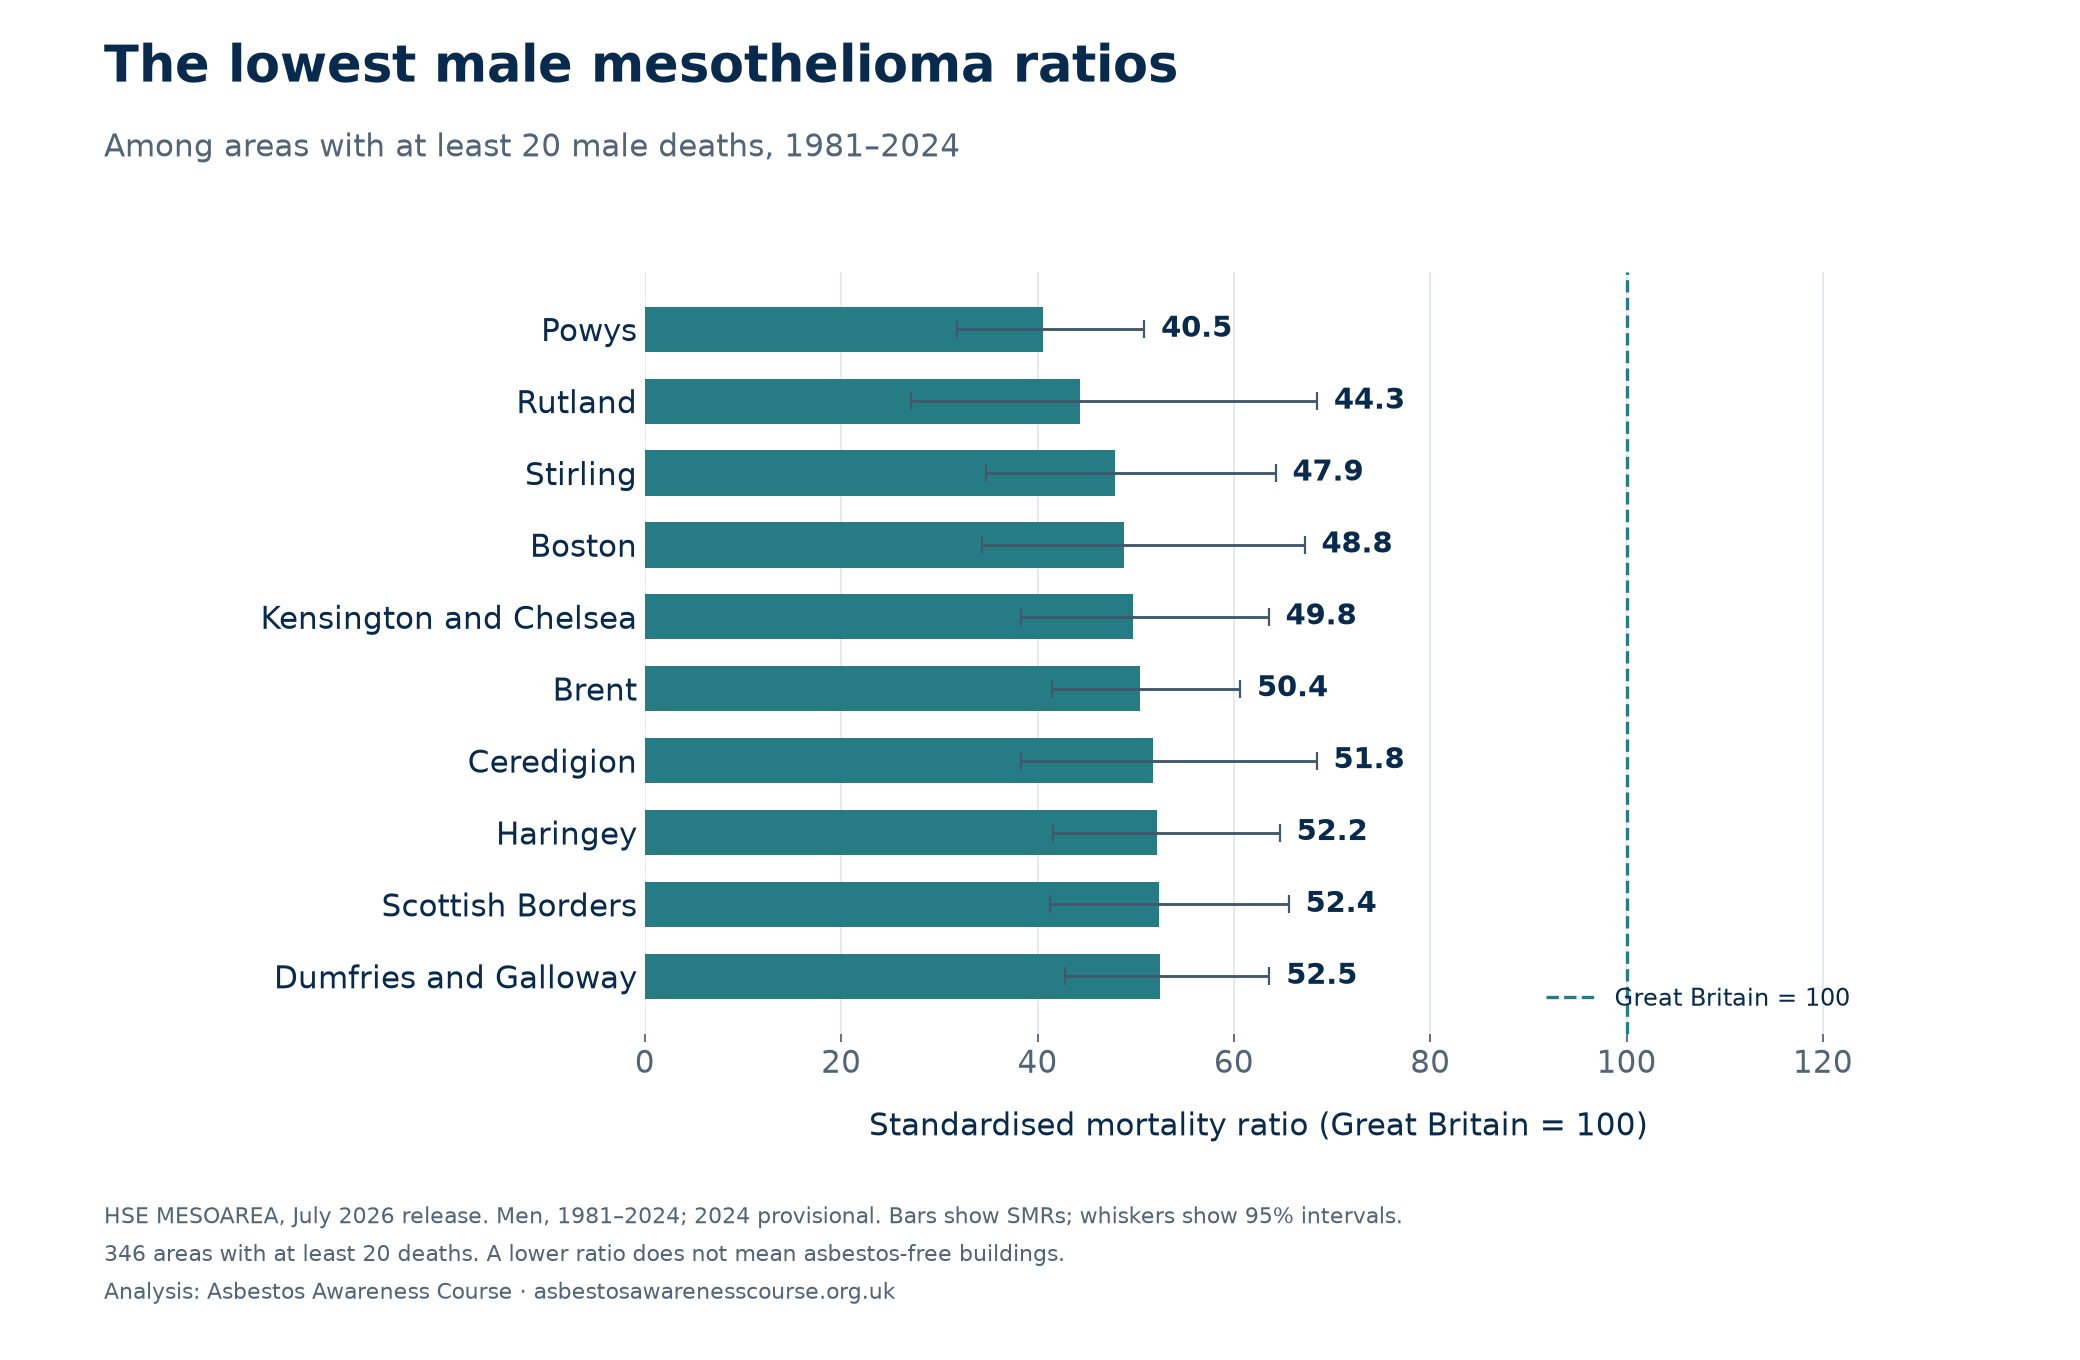
Switch to women in the explorer below to see the female comparisons. All 350 areas remain available, including those with too few deaths to rank.
Why the figures vary
Past industry leaves a local pattern
HSE identifies shipbuilding as a common history among the six areas with the highest male ratios. Construction exposure was more geographically widespread. This helps explain the broad pattern, but an area total cannot establish the cause of an individual person’s disease. Sources 2–3
People move after exposure
A worker may have been exposed in one place and retired to another. HSE’s figures use residence at death, so migration can weaken or redistribute the geographical pattern. Lower figures cannot be credited to today’s local safety policies using this dataset.
The long-term ranking is different from the recent picture
In West Dunbartonshire, the male SMR was 763.5 in 1990–1994 and 155.2 in 2020–2024. The latter is based on only 19 deaths. Its high position in the 44-year comparison therefore should not be presented as the highest current rate.
An SMR compares an area with Great Britain during the same period. A falling SMR means the area’s mortality is lower relative to that benchmark; it does not, by itself, prove a fall in its absolute death rate. The local charts below show both counts and ratios.
The map also reflects council reorganisations. Barrow-in-Furness now appears within Westmorland and Furness; comparing the old and new areas as if they were identical would be misleading.
Mesothelioma deaths by area in 2020–2024
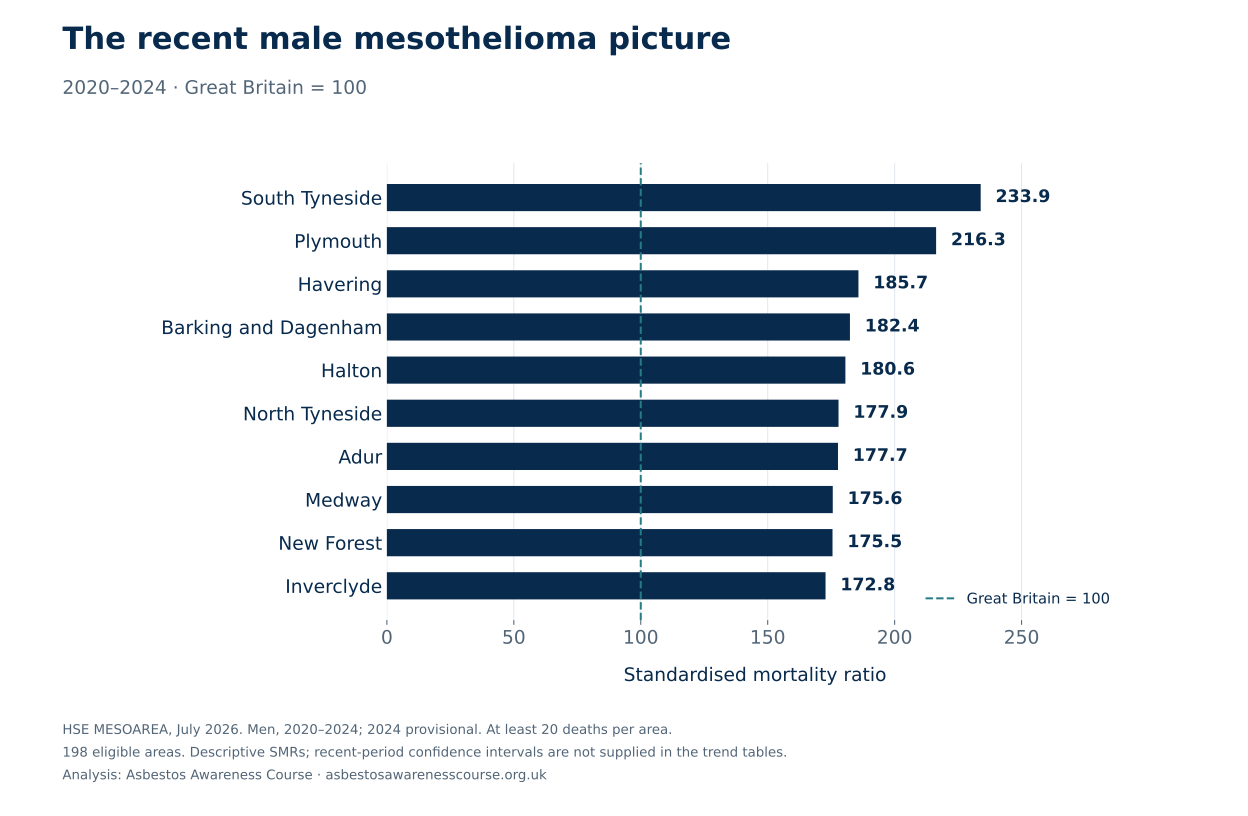
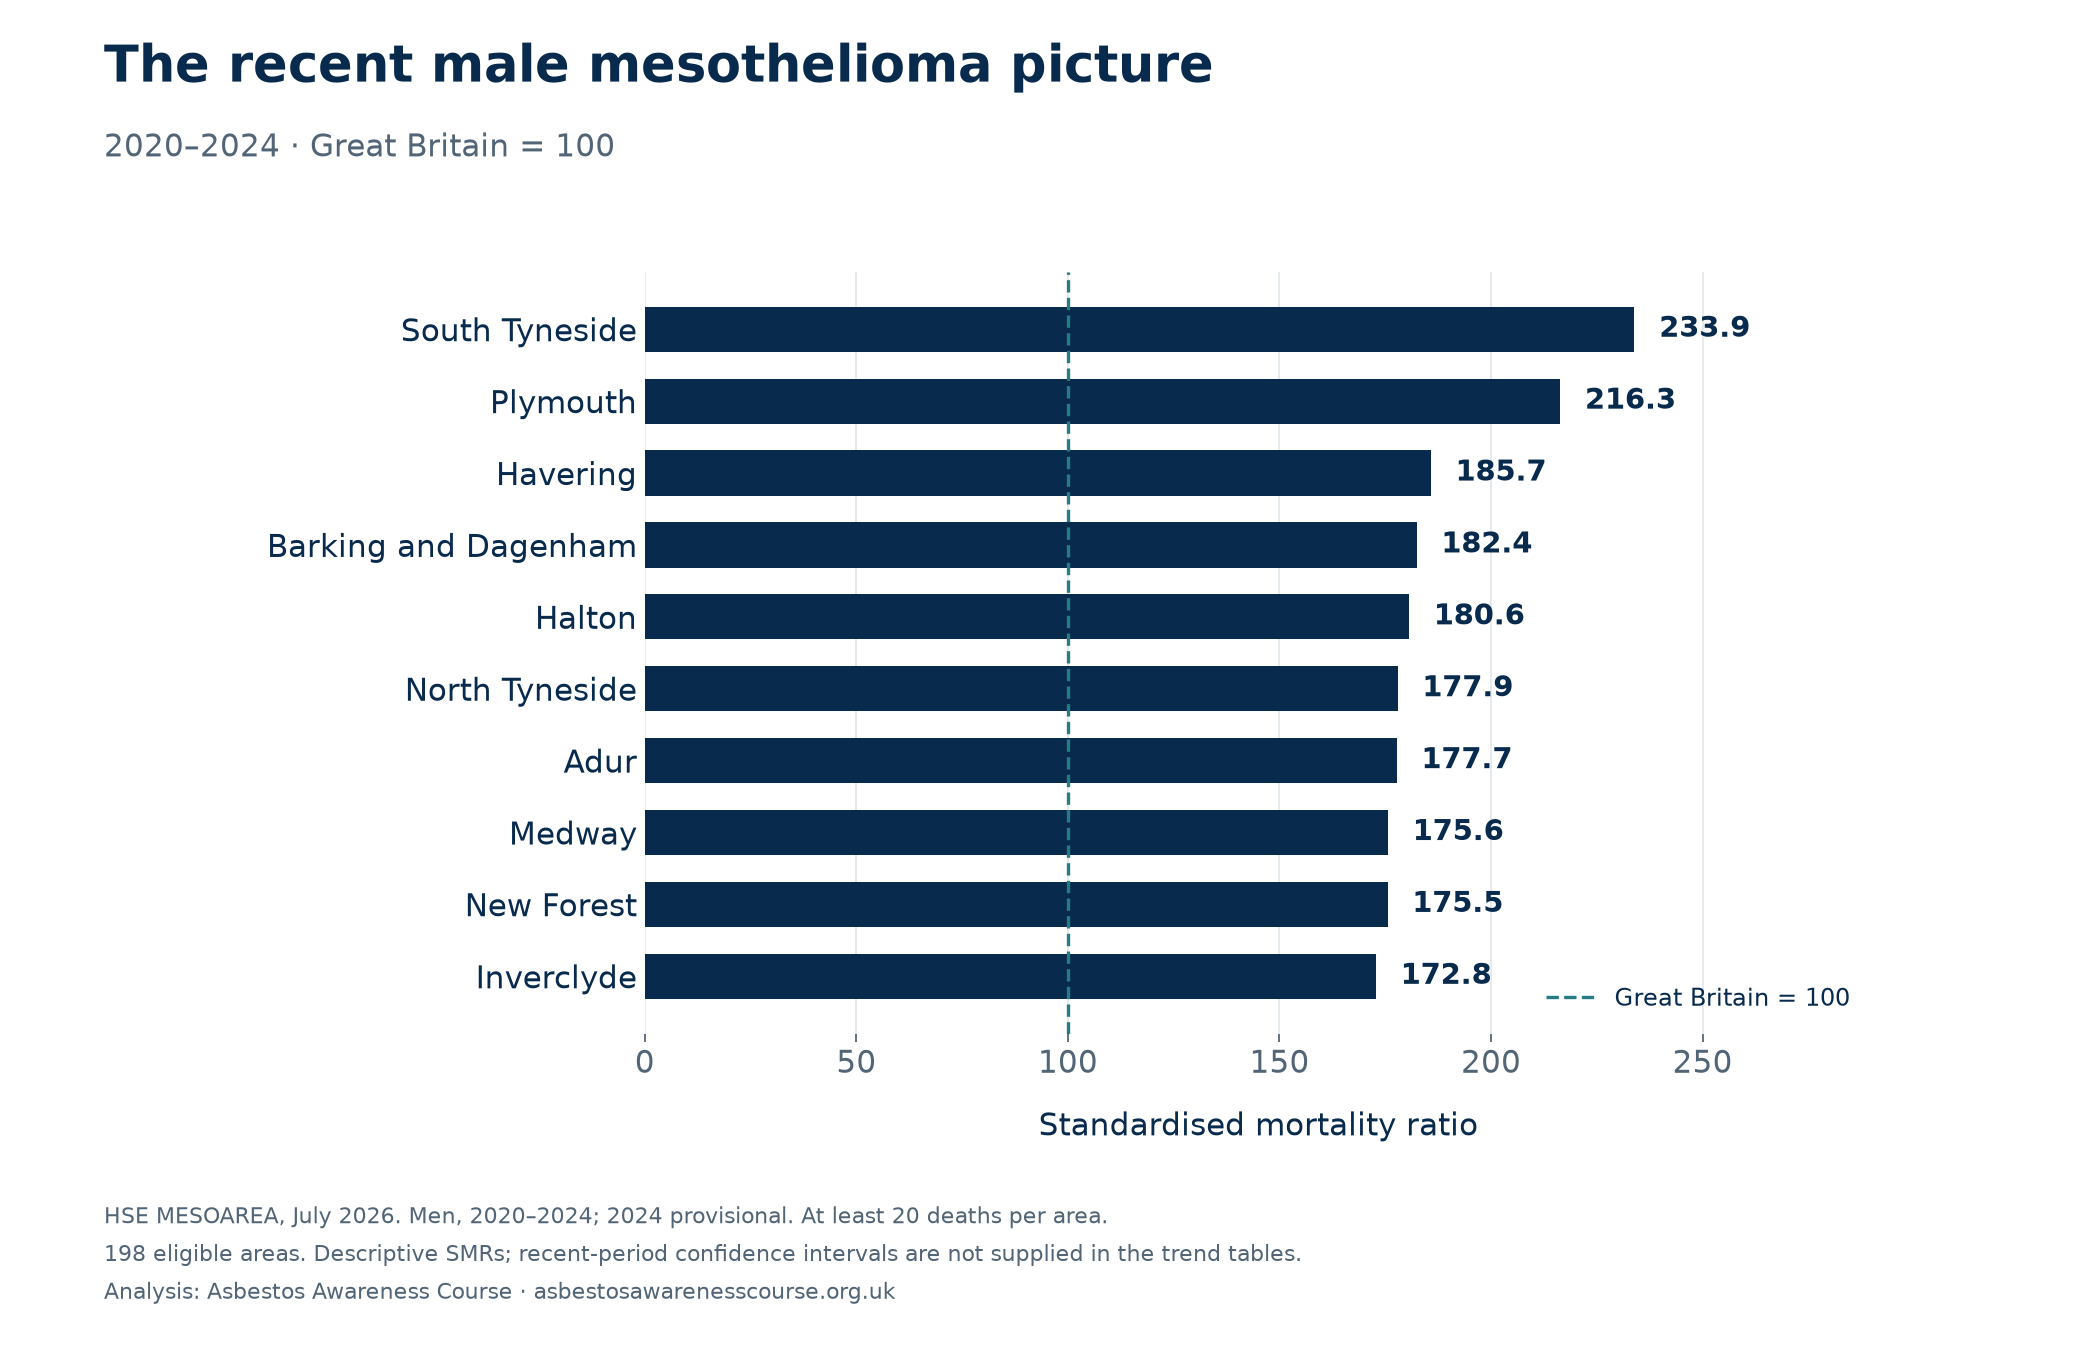
South Tyneside had the highest recent male ratio among the 198 areas with at least 20 male deaths: an SMR of 233.9, based on 54 deaths. Plymouth followed at 216.3 (82 deaths), and Havering at 185.7 (65 deaths).
That is a different list from the full 1981–2024 comparison. West Dunbartonshire, which leads the long-term male table, recorded 19 male deaths in 2020–2024. Its recent SMR was 155.2, but it falls below the same 20-death threshold when that rule is applied to the shorter period.
Both periods use the same council geography. Each ratio compares an area with the national age-specific mortality rates during its own period. A change in SMR is therefore a change relative to that period’s benchmark, not necessarily a change in the absolute death rate.
| Area | Male deaths 2020–24 | SMR 2020–24 | SMR 1981–2024 |
|---|---|---|---|
| South Tyneside | 54 | 233.9 | 272.5 |
| Plymouth | 82 | 216.3 | 256.2 |
| Havering | 65 | 185.7 | 179.0 |
| Barking and Dagenham | 25 | 182.4 | 212.1 |
| Halton | 32 | 180.6 | 151.9 |
| North Tyneside | 57 | 177.9 | 271.9 |
| Adur | 21 | 177.7 | 119.8 |
| Medway | 61 | 175.6 | 228.8 |
| New Forest | 74 | 175.5 | 138.4 |
| Inverclyde | 21 | 172.8 | 190.9 |
The recent table supplies no confidence intervals. These descriptive ranks do not prove differences between areas. Only seven areas meet the 20-death rule for women in 2020–2024, so we do not publish a recent female “top ten”. The explorer retains every area and flags small counts.
Switch the map between 1981–2024 and 2020–2024, or download recent figures for every area.
Women’s mesothelioma deaths show a different local pattern
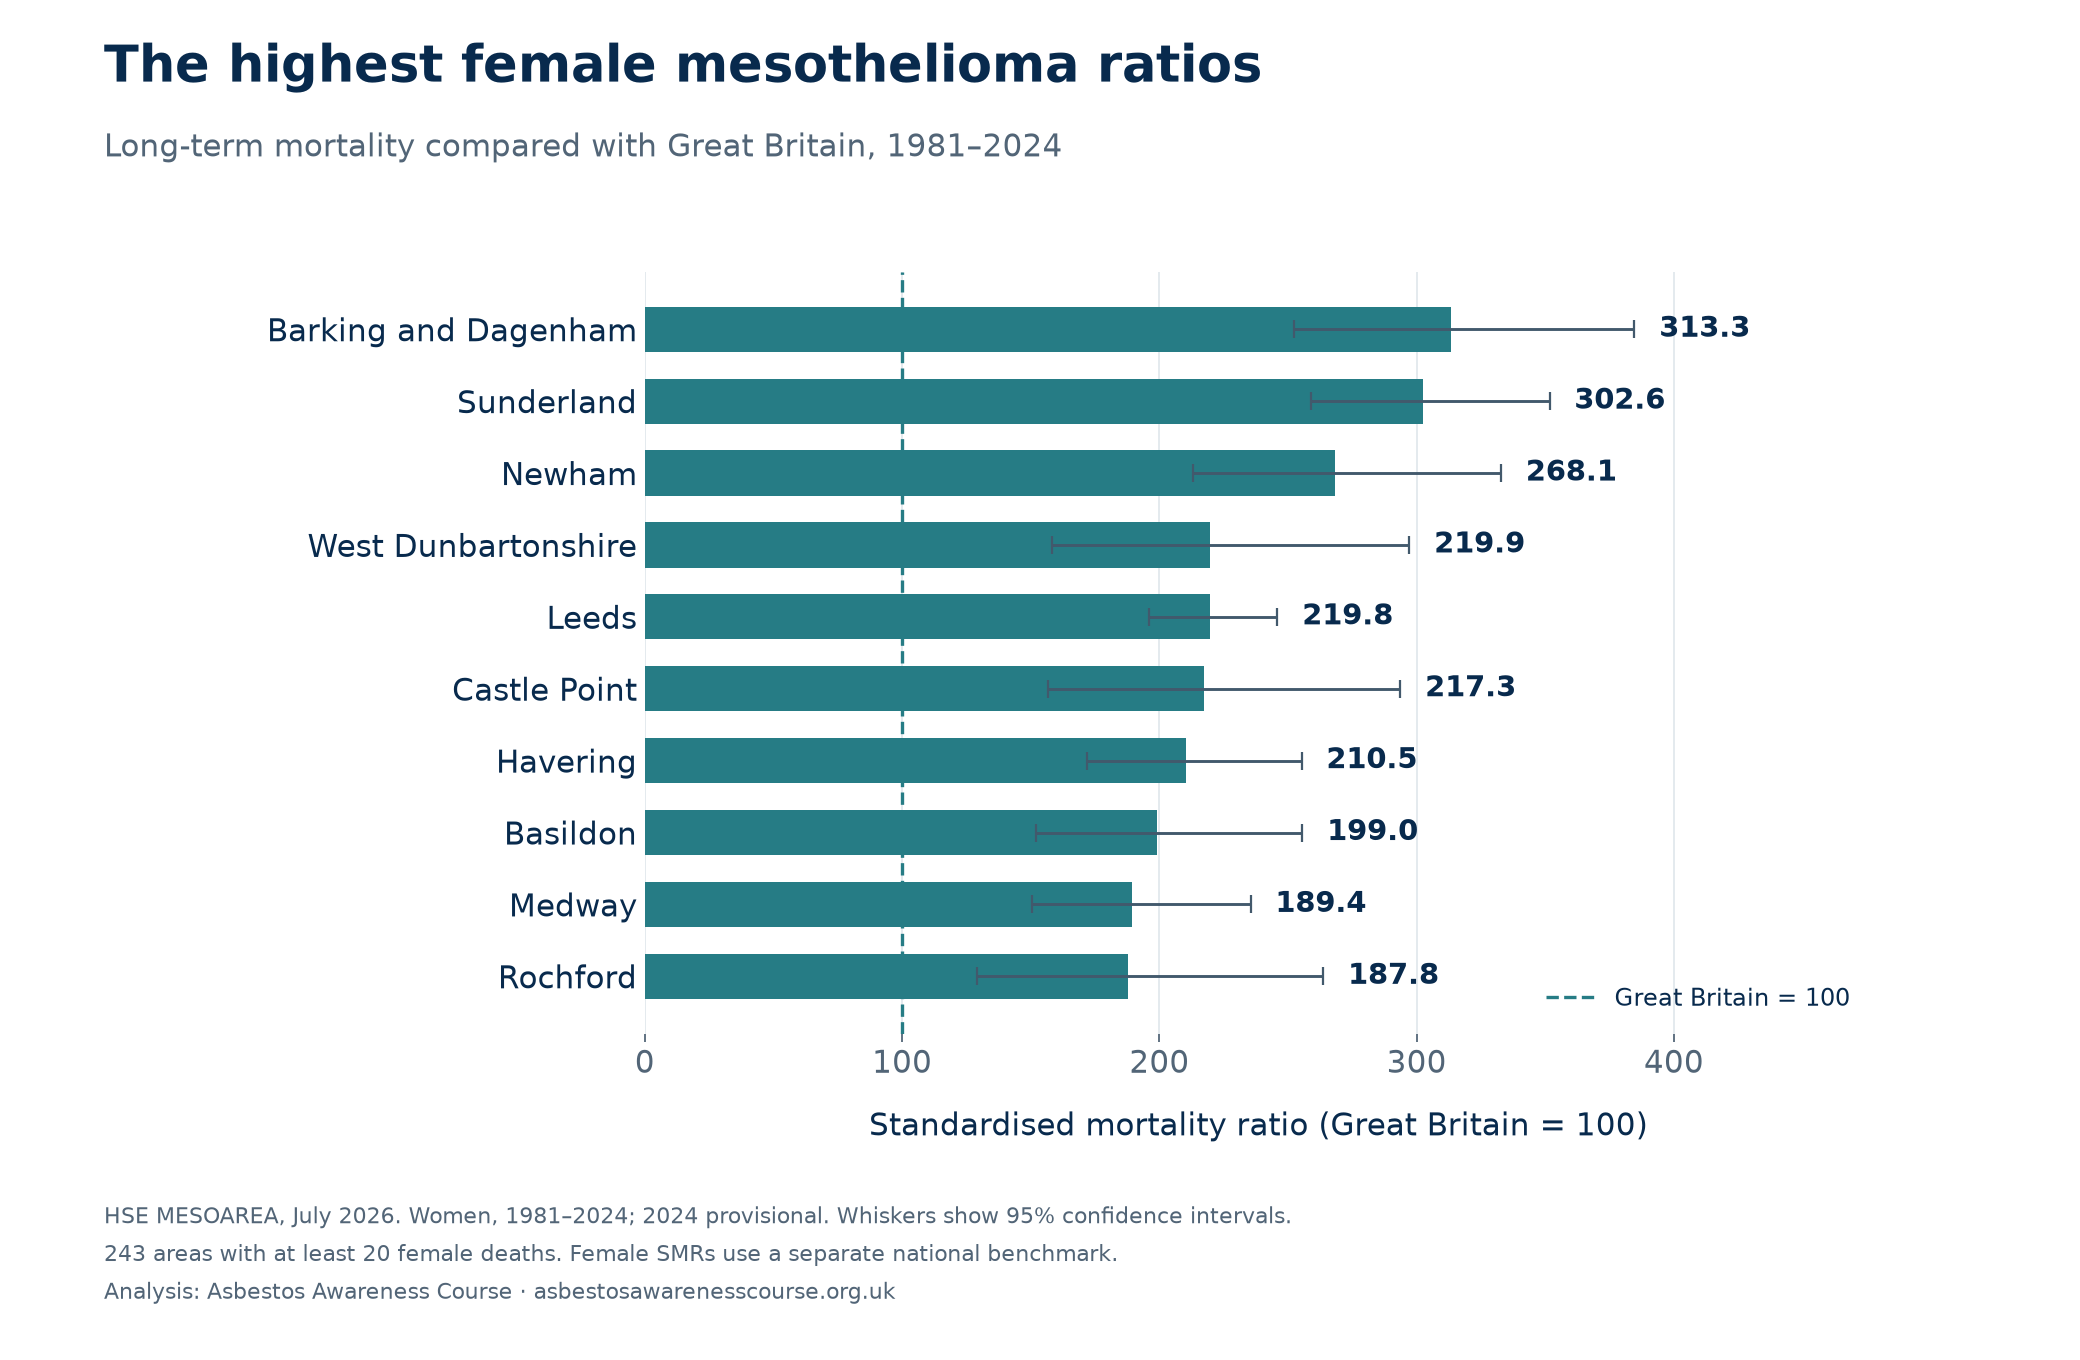
Barking and Dagenham, Sunderland and Newham lead the long-term female comparison. Their SMRs were 313.3, 302.6 and 268.1 respectively. Barking and Dagenham recorded 91 female deaths, Sunderland 170 and Newham 82 over 1981–2024.
The male and female measures use separate benchmarks. The female table describes where mortality among women was high relative to women nationally; it does not mean women had more deaths than men. Area totals cannot distinguish occupational, household or environmental exposure pathways for an individual.
| Area | Female deaths | SMR | 95% interval |
|---|---|---|---|
| Barking and Dagenham | 91 | 313.3 | 252.3–384.7 |
| Sunderland | 170 | 302.6 | 258.8–351.7 |
| Newham | 82 | 268.1 | 213.2–332.8 |
| West Dunbartonshire | 42 | 219.9 | 158.5–297.2 |
| Leeds | 306 | 219.8 | 195.9–245.9 |
| Castle Point | 42 | 217.3 | 156.6–293.7 |
| Havering | 103 | 210.5 | 171.8–255.3 |
| Basildon | 61 | 199.0 | 152.2–255.6 |
| Medway | 81 | 189.4 | 150.5–235.5 |
| Rochford | 33 | 187.8 | 129.3–263.7 |
The five lowest eligible female ratios
| Area | Female deaths | SMR | 95% interval |
|---|---|---|---|
| Barnsley | 21 | 45.9 | 28.4–70.1 |
| Coventry | 30 | 53.3 | 36.0–76.2 |
| Swansea | 27 | 53.5 | 35.2–77.8 |
| Carmarthenshire | 23 | 53.9 | 34.2–80.9 |
| Leicester | 27 | 54.2 | 35.7–78.8 |
A lower historical mortality ratio does not establish that buildings are asbestos-free or that present-day exposure is lower.
Explore the map and find your area
Switch between the long-term and recent five-year figures. Great Britain = 100 within each period. Grey areas have fewer than 20 deaths for the selected sex and period. Select a country to enlarge that part of the map.
Standardised mortality ratio (SMR), 1981–2024; Great Britain = 100
- Under 50
- 50–<80
- 80–<100
- 100–<150
- 150–<200
- 200+
- Not in this comparison
Boundaries: ONS, May 2024. Contains OS data © Crown copyright and database right 2026; ONS data © Crown copyright 2026. The table provides the same figures without using the map.
Download the male mortality map (PNG)
Compare two areas
Search the full table
350 council areas shown. Download the full CSV for every comparison.
| Area | Country | Deaths | SMR | 95% interval | Comparison with GB |
|---|---|---|---|---|---|
| Scotland | 308 | 337.1 | 300.5–377.0 | Above GB | |
| England | 468 | 272.5 | 248.4–298.3 | Above GB | |
| England | 604 | 271.9 | 250.6–294.5 | Above GB | |
| England | 482 | 256.5 | 234.1–280.5 | Above GB | |
| England | 674 | 256.2 | 237.3–276.3 | Above GB | |
| England | 527 | 228.8 | 209.7–249.2 | Above GB | |
| England | 207 | 215.1 | 186.8–246.5 | Above GB | |
| England | 304 | 212.1 | 188.9–237.4 | Above GB | |
| England | 439 | 211.1 | 191.8–231.8 | Above GB | |
| England | 177 | 209.9 | 180.1–243.3 | Above GB | |
| England | 258 | 206.2 | 181.8–233.0 | Above GB | |
| England | 256 | 195.0 | 171.8–220.4 | Above GB | |
| England | 519 | 192.4 | 176.2–209.6 | Above GB | |
| Scotland | 171 | 190.9 | 163.4–221.8 | Above GB | |
| England | 344 | 188.8 | 169.4–209.9 | Above GB | |
| England | 279 | 187.8 | 166.4–211.2 | Above GB | |
| England | 200 | 187.7 | 162.5–215.5 | Above GB | |
| England | 540 | 184.3 | 169.1–200.5 | Above GB | |
| England | 456 | 179.0 | 162.9–196.2 | Above GB | |
| England | 223 | 175.6 | 153.3–200.2 | Above GB | |
| England | 507 | 170.1 | 155.6–185.6 | Above GB | |
| Scotland | 288 | 164.0 | 145.6–184.0 | Above GB | |
| England | 263 | 163.8 | 144.6–184.9 | Above GB | |
| England | 292 | 160.0 | 142.2–179.5 | Above GB | |
| England | 591 | 157.7 | 145.3–171.0 | Above GB | |
| England | 253 | 156.5 | 137.8–177.1 | Above GB | |
| England | 317 | 156.5 | 139.7–174.7 | Above GB | |
| Scotland | 830 | 152.8 | 142.6–163.6 | Above GB | |
| England | 177 | 151.9 | 130.3–176.0 | Above GB | |
| England | 151 | 151.5 | 128.3–177.7 | Above GB | |
| England | 239 | 150.7 | 132.2–171.1 | Above GB | |
| England | 324 | 147.3 | 131.7–164.3 | Above GB | |
| England | 202 | 145.9 | 126.5–167.5 | Above GB | |
| England | 463 | 145.1 | 132.2–158.9 | Above GB | |
| England | 138 | 141.6 | 118.9–167.3 | Above GB | |
| England | 161 | 140.2 | 119.4–163.6 | Above GB | |
| England | 360 | 138.4 | 124.5–153.4 | Above GB | |
| England | 117 | 138.4 | 114.4–165.9 | Above GB | |
| England | 184 | 137.7 | 118.5–159.1 | Above GB | |
| England | 88 | 137.0 | 109.9–168.8 | Above GB | |
| England | 312 | 136.1 | 121.4–152.1 | Above GB | |
| England | 324 | 133.5 | 119.3–148.8 | Above GB | |
| Scotland | 155 | 132.0 | 112.0–154.5 | Above GB | |
| England | 115 | 131.9 | 108.9–158.3 | Above GB | |
| England | 298 | 129.0 | 114.8–144.5 | Above GB | |
| England | 260 | 127.9 | 112.9–144.5 | Above GB | |
| England | 278 | 126.4 | 112.0–142.2 | Above GB | |
| England | 212 | 125.5 | 109.2–143.6 | Above GB | |
| England | 177 | 124.6 | 107.0–144.4 | Above GB | |
| England | 208 | 124.6 | 108.2–142.7 | Above GB | |
| England | 159 | 124.3 | 105.8–145.2 | Above GB | |
| England | 200 | 124.3 | 107.7–142.8 | Above GB | |
| England | 291 | 123.6 | 109.8–138.6 | Above GB | |
| Wales | 171 | 122.3 | 104.7–142.1 | Above GB | |
| England | 139 | 122.2 | 102.7–144.3 | Above GB | |
| Scotland | 472 | 121.8 | 111.0–133.3 | Above GB | |
| England | 88 | 121.4 | 97.4–149.6 | Interval includes GB | |
| England | 873 | 121.0 | 113.1–129.3 | Above GB | |
| England | 145 | 120.6 | 101.7–141.9 | Above GB | |
| England | 224 | 120.3 | 105.1–137.1 | Above GB | |
| England | 517 | 120.3 | 110.1–131.1 | Above GB | |
| England | 99 | 119.8 | 97.4–145.8 | Interval includes GB | |
| England | 150 | 119.3 | 101.0–140.0 | Above GB | |
| Scotland | 177 | 119.1 | 102.2–138.0 | Above GB | |
| England | 87 | 118.3 | 94.8–146.0 | Interval includes GB | |
| England | 163 | 116.9 | 99.7–136.3 | Interval includes GB | |
| England | 302 | 116.4 | 103.6–130.3 | Above GB | |
| England | 103 | 116.3 | 94.9–141.1 | Interval includes GB | |
| Scotland | 178 | 115.5 | 99.1–133.7 | Interval includes GB | |
| England | 212 | 115.1 | 100.1–131.7 | Above GB | |
| England | 132 | 113.9 | 95.3–135.1 | Interval includes GB | |
| England | 360 | 113.9 | 102.4–126.3 | Above GB | |
| England | 114 | 113.5 | 93.6–136.4 | Interval includes GB | |
| England | 147 | 113.1 | 95.6–132.9 | Interval includes GB | |
| England | 304 | 113.0 | 100.6–126.4 | Above GB | |
| England | 155 | 112.7 | 95.7–132.0 | Interval includes GB | |
| England | 376 | 112.0 | 100.9–123.9 | Above GB | |
| England | 105 | 111.7 | 91.3–135.2 | Interval includes GB | |
| England | 98 | 111.4 | 90.5–135.8 | Interval includes GB | |
| England | 251 | 111.1 | 97.7–125.7 | Interval includes GB | |
| England | 181 | 111.0 | 95.4–128.4 | Interval includes GB | |
| England | 202 | 111.0 | 96.2–127.4 | Interval includes GB | |
| England | 165 | 111.0 | 94.7–129.3 | Interval includes GB | |
| England | 229 | 110.6 | 96.7–125.9 | Interval includes GB | |
| England | 194 | 110.4 | 95.4–127.1 | Interval includes GB | |
| England | 145 | 109.8 | 92.6–129.1 | Interval includes GB | |
| England | 144 | 109.3 | 92.2–128.7 | Interval includes GB | |
| England | 133 | 109.2 | 91.4–129.4 | Interval includes GB | |
| England | 161 | 108.7 | 92.6–126.9 | Interval includes GB | |
| England | 416 | 107.7 | 97.6–118.6 | Interval includes GB | |
| England | 92 | 107.6 | 86.7–131.9 | Interval includes GB | |
| England | 398 | 107.4 | 97.1–118.4 | Interval includes GB | |
| England | 160 | 107.3 | 91.3–125.3 | Interval includes GB | |
| England | 168 | 107.3 | 91.7–124.8 | Interval includes GB | |
| England | 146 | 106.8 | 90.1–125.6 | Interval includes GB | |
| England | 116 | 106.7 | 88.2–128.0 | Interval includes GB | |
| England | 148 | 106.0 | 89.6–124.6 | Interval includes GB | |
| England | 119 | 106.0 | 87.8–126.9 | Interval includes GB | |
| England | 213 | 106.0 | 92.2–121.2 | Interval includes GB | |
| England | 76 | 105.8 | 83.3–132.4 | Interval includes GB | |
| England | 140 | 105.7 | 88.9–124.7 | Interval includes GB | |
| England | 137 | 105.6 | 88.7–124.9 | Interval includes GB | |
| England | 133 | 105.6 | 88.4–125.2 | Interval includes GB | |
| England | 97 | 105.4 | 85.5–128.6 | Interval includes GB | |
| England | 442 | 105.3 | 95.7–115.6 | Interval includes GB | |
| England | 120 | 105.2 | 87.2–125.8 | Interval includes GB | |
| England | 87 | 104.5 | 83.7–128.9 | Interval includes GB | |
| England | 408 | 104.5 | 94.6–115.1 | Interval includes GB | |
| England | 90 | 104.5 | 84.0–128.4 | Interval includes GB | |
| England | 114 | 104.4 | 86.1–125.4 | Interval includes GB | |
| England | 134 | 104.0 | 87.2–123.2 | Interval includes GB | |
| England | 192 | 103.8 | 89.6–119.6 | Interval includes GB | |
| England | 72 | 103.1 | 80.6–129.8 | Interval includes GB | |
| England | 84 | 103.0 | 82.1–127.5 | Interval includes GB | |
| England | 167 | 102.8 | 87.8–119.6 | Interval includes GB | |
| England | 121 | 101.9 | 84.6–121.8 | Interval includes GB | |
| England | 406 | 101.8 | 92.1–112.2 | Interval includes GB | |
| England | 321 | 101.7 | 90.9–113.4 | Interval includes GB | |
| England | 139 | 101.6 | 85.4–119.9 | Interval includes GB | |
| England | 143 | 101.5 | 85.6–119.6 | Interval includes GB | |
| England | 125 | 101.5 | 84.5–120.9 | Interval includes GB | |
| England | 94 | 101.5 | 82.0–124.2 | Interval includes GB | |
| England | 145 | 101.4 | 85.6–119.4 | Interval includes GB | |
| England | 139 | 101.1 | 85.0–119.4 | Interval includes GB | |
| England | 173 | 100.6 | 86.1–116.7 | Interval includes GB | |
| England | 178 | 100.6 | 86.3–116.5 | Interval includes GB | |
| England | 182 | 100.2 | 86.2–115.9 | Interval includes GB | |
| England | 89 | 99.7 | 80.1–122.7 | Interval includes GB | |
| England | 693 | 99.4 | 92.1–107.1 | Interval includes GB | |
| England | 165 | 99.3 | 84.7–115.6 | Interval includes GB | |
| England | 244 | 99.0 | 87.0–112.3 | Interval includes GB | |
| England | 226 | 99.0 | 86.5–112.8 | Interval includes GB | |
| England | 155 | 98.9 | 83.9–115.7 | Interval includes GB | |
| England | 336 | 98.8 | 88.5–109.9 | Interval includes GB | |
| England | 201 | 98.8 | 85.6–113.4 | Interval includes GB | |
| Scotland | 113 | 98.5 | 81.2–118.4 | Interval includes GB | |
| England | 122 | 98.5 | 81.8–117.6 | Interval includes GB | |
| England | 248 | 98.0 | 86.2–111.0 | Interval includes GB | |
| England | 129 | 97.9 | 81.7–116.3 | Interval includes GB | |
| England | 110 | 97.6 | 80.2–117.7 | Interval includes GB | |
| England | 320 | 97.5 | 87.1–108.8 | Interval includes GB | |
| England | 203 | 97.2 | 84.3–111.5 | Interval includes GB | |
| England | 546 | 96.9 | 88.9–105.3 | Interval includes GB | |
| Scotland | 298 | 96.8 | 86.1–108.4 | Interval includes GB | |
| England | 119 | 96.6 | 80.0–115.6 | Interval includes GB | |
| England | 237 | 96.5 | 84.6–109.7 | Interval includes GB | |
| England | 427 | 96.5 | 87.6–106.1 | Interval includes GB | |
| England | 471 | 96.5 | 88.0–105.6 | Interval includes GB | |
| England | 326 | 96.2 | 86.0–107.2 | Interval includes GB | |
| England | 156 | 96.2 | 81.7–112.5 | Interval includes GB | |
| England | 116 | 95.8 | 79.1–114.9 | Interval includes GB | |
| England | 162 | 95.8 | 81.6–111.7 | Interval includes GB | |
| England | 227 | 95.6 | 83.5–108.8 | Interval includes GB | |
| England | 203 | 95.6 | 82.9–109.7 | Interval includes GB | |
| England | 60 | 95.5 | 72.9–123.0 | Interval includes GB | |
| Scotland | 420 | 95.4 | 86.5–104.9 | Interval includes GB | |
| England | 70 | 95.4 | 74.3–120.5 | Interval includes GB | |
| Wales | 135 | 94.8 | 79.5–112.2 | Interval includes GB | |
| England | 87 | 94.8 | 75.9–116.9 | Interval includes GB | |
| England | 118 | 94.6 | 78.3–113.4 | Interval includes GB | |
| England | 93 | 94.6 | 76.4–115.9 | Interval includes GB | |
| England | 182 | 94.2 | 81.0–108.9 | Interval includes GB | |
| England | 482 | 93.9 | 85.7–102.7 | Interval includes GB | |
| Wales | 277 | 93.9 | 83.1–105.6 | Interval includes GB | |
| England | 69 | 93.7 | 72.9–118.6 | Interval includes GB | |
| England | 305 | 93.6 | 83.4–104.8 | Interval includes GB | |
| England | 124 | 93.5 | 77.8–111.5 | Interval includes GB | |
| England | 145 | 93.5 | 78.9–110.0 | Interval includes GB | |
| Scotland | 130 | 93.3 | 77.9–110.7 | Interval includes GB | |
| England | 132 | 93.1 | 77.9–110.4 | Interval includes GB | |
| England | 97 | 93.0 | 75.4–113.5 | Interval includes GB | |
| England | 134 | 92.8 | 77.8–110.0 | Interval includes GB | |
| England | 106 | 92.8 | 76.0–112.2 | Interval includes GB | |
| Wales | 136 | 92.4 | 77.5–109.3 | Interval includes GB | |
| England | 162 | 92.2 | 78.5–107.5 | Interval includes GB | |
| England | 136 | 92.1 | 77.3–108.9 | Interval includes GB | |
| England | 211 | 91.4 | 79.5–104.6 | Interval includes GB | |
| England | 209 | 91.3 | 79.3–104.5 | Interval includes GB | |
| England | 113 | 91.3 | 75.2–109.7 | Interval includes GB | |
| England | 138 | 91.2 | 76.6–107.8 | Interval includes GB | |
| England | 166 | 91.2 | 77.9–106.2 | Interval includes GB | |
| England | 183 | 91.1 | 78.4–105.3 | Interval includes GB | |
| England | 179 | 91.1 | 78.2–105.5 | Interval includes GB | |
| England | 144 | 90.9 | 76.7–107.0 | Interval includes GB | |
| England | 62 | 90.6 | 69.5–116.2 | Interval includes GB | |
| England | 117 | 90.5 | 74.8–108.5 | Interval includes GB | |
| Scotland | 185 | 90.2 | 77.7–104.2 | Interval includes GB | |
| England | 79 | 90.0 | 71.3–112.2 | Interval includes GB | |
| Scotland | 140 | 89.9 | 75.6–106.1 | Interval includes GB | |
| England | 63 | 89.8 | 69.0–114.9 | Interval includes GB | |
| Scotland | 97 | 89.6 | 72.7–109.3 | Interval includes GB | |
| England | 92 | 89.6 | 72.2–109.9 | Interval includes GB | |
| England | 85 | 89.5 | 71.5–110.6 | Interval includes GB | |
| England | 137 | 89.4 | 75.0–105.6 | Interval includes GB | |
| England | 100 | 89.0 | 72.4–108.3 | Interval includes GB | |
| Scotland | 75 | 88.9 | 69.9–111.5 | Interval includes GB | |
| England | 100 | 88.5 | 72.0–107.7 | Interval includes GB | |
| England | 102 | 88.5 | 72.2–107.4 | Interval includes GB | |
| England | 315 | 88.5 | 79.0–98.8 | Below GB | |
| England | 105 | 88.5 | 72.4–107.1 | Interval includes GB | |
| Wales | 112 | 88.4 | 72.8–106.4 | Interval includes GB | |
| Scotland | 265 | 88.3 | 78.0–99.6 | Below GB | |
| England | 175 | 88.2 | 75.6–102.2 | Interval includes GB | |
| England | 78 | 87.9 | 69.5–109.7 | Interval includes GB | |
| England | 116 | 87.9 | 72.6–105.4 | Interval includes GB | |
| Wales | 135 | 87.8 | 73.6–103.9 | Interval includes GB | |
| England | 220 | 87.7 | 76.5–100.0 | Interval includes GB | |
| England | 116 | 87.3 | 72.2–104.8 | Interval includes GB | |
| England | 90 | 87.3 | 70.2–107.3 | Interval includes GB | |
| England | 169 | 86.9 | 74.3–101.0 | Interval includes GB | |
| Scotland | 81 | 86.7 | 68.9–107.8 | Interval includes GB | |
| Wales | 231 | 86.6 | 75.8–98.6 | Below GB | |
| England | 63 | 86.5 | 66.5–110.7 | Interval includes GB | |
| England | 390 | 86.3 | 78.0–95.3 | Below GB | |
| England | 464 | 85.7 | 78.0–93.8 | Below GB | |
| England | 446 | 85.3 | 77.5–93.6 | Below GB | |
| England | 216 | 85.0 | 74.0–97.1 | Below GB | |
| England | 80 | 84.8 | 67.3–105.6 | Interval includes GB | |
| England | 94 | 84.5 | 68.3–103.4 | Interval includes GB | |
| England | 112 | 84.4 | 69.5–101.6 | Interval includes GB | |
| England | 264 | 83.9 | 74.0–94.6 | Below GB | |
| England | 123 | 83.6 | 69.5–99.7 | Below GB | |
| England | 62 | 83.4 | 63.9–106.9 | Interval includes GB | |
| England | 115 | 83.4 | 68.8–100.1 | Interval includes GB | |
| Wales | 135 | 83.3 | 69.8–98.6 | Below GB | |
| England | 120 | 83.0 | 68.8–99.3 | Below GB | |
| England | 132 | 82.4 | 68.9–97.7 | Below GB | |
| England | 106 | 82.3 | 67.4–99.6 | Below GB | |
| England | 81 | 82.3 | 65.3–102.3 | Interval includes GB | |
| England | 128 | 82.0 | 68.4–97.6 | Below GB | |
| England | 76 | 82.0 | 64.6–102.7 | Interval includes GB | |
| England | 185 | 82.0 | 70.6–94.7 | Below GB | |
| England | 151 | 81.7 | 69.2–95.8 | Below GB | |
| Wales | 82 | 81.6 | 64.9–101.3 | Interval includes GB | |
| England | 146 | 81.5 | 68.8–95.8 | Below GB | |
| England | 91 | 81.4 | 65.6–100.0 | Below GB | |
| England | 111 | 80.9 | 66.5–97.4 | Below GB | |
| England | 135 | 80.5 | 67.5–95.2 | Below GB | |
| England | 118 | 80.2 | 66.4–96.1 | Below GB | |
| Scotland | 40 | 80.1 | 57.2–109.1 | Interval includes GB | |
| England | 576 | 80.1 | 73.7–86.9 | Below GB | |
| England | 111 | 79.9 | 65.7–96.2 | Below GB | |
| England | 455 | 79.8 | 72.6–87.5 | Below GB | |
| England | 160 | 79.8 | 67.9–93.2 | Below GB | |
| England | 94 | 79.8 | 64.5–97.6 | Below GB | |
| England | 120 | 79.8 | 66.1–95.4 | Below GB | |
| England | 120 | 79.7 | 66.1–95.3 | Below GB | |
| England | 113 | 79.2 | 65.3–95.2 | Below GB | |
| England | 131 | 78.9 | 65.9–93.6 | Below GB | |
| England | 85 | 78.6 | 62.8–97.2 | Below GB | |
| Scotland | 198 | 78.4 | 67.8–90.1 | Below GB | |
| England | 280 | 78.2 | 69.3–87.9 | Below GB | |
| England | 74 | 78.2 | 61.4–98.1 | Below GB | |
| England | 100 | 77.9 | 63.4–94.8 | Below GB | |
| England | 79 | 77.9 | 61.7–97.1 | Below GB | |
| England | 76 | 77.6 | 61.1–97.1 | Below GB | |
| England | 110 | 77.2 | 63.4–93.0 | Below GB | |
| England | 105 | 77.1 | 63.1–93.4 | Below GB | |
| Wales | 69 | 76.6 | 59.6–96.9 | Below GB | |
| England | 539 | 76.6 | 70.3–83.3 | Below GB | |
| England | 145 | 75.8 | 64.0–89.2 | Below GB | |
| England | 204 | 75.1 | 65.2–86.2 | Below GB | |
| England | 82 | 75.1 | 59.8–93.3 | Below GB | |
| England | 85 | 74.9 | 59.8–92.6 | Below GB | |
| England | 224 | 74.7 | 65.3–85.2 | Below GB | |
| Scotland | 106 | 74.6 | 61.1–90.2 | Below GB | |
| England | 63 | 74.5 | 57.3–95.3 | Below GB | |
| England | 195 | 74.2 | 64.1–85.3 | Below GB | |
| England | 121 | 74.0 | 61.4–88.5 | Below GB | |
| England | 90 | 73.9 | 59.5–90.9 | Below GB | |
| England | 97 | 73.8 | 59.9–90.1 | Below GB | |
| England | 88 | 73.8 | 59.2–91.0 | Below GB | |
| England | 78 | 73.6 | 58.2–91.9 | Below GB | |
| England | 70 | 73.2 | 57.1–92.5 | Below GB | |
| Wales | 108 | 73.2 | 60.0–88.4 | Below GB | |
| England | 220 | 73.0 | 63.7–83.3 | Below GB | |
| England | 92 | 73.0 | 58.8–89.5 | Below GB | |
| England | 63 | 73.0 | 56.1–93.3 | Below GB | |
| England | 93 | 72.9 | 58.8–89.3 | Below GB | |
| England | 87 | 72.3 | 57.9–89.2 | Below GB | |
| England | 88 | 72.3 | 58.0–89.1 | Below GB | |
| England | 89 | 72.3 | 58.1–89.0 | Below GB | |
| England | 150 | 72.1 | 61.0–84.6 | Below GB | |
| England | 248 | 71.9 | 63.2–81.4 | Below GB | |
| England | 60 | 71.8 | 54.8–92.4 | Below GB | |
| England | 108 | 71.5 | 58.6–86.3 | Below GB | |
| England | 110 | 71.2 | 58.5–85.8 | Below GB | |
| England | 193 | 70.6 | 61.0–81.3 | Below GB | |
| England | 72 | 70.6 | 55.2–88.9 | Below GB | |
| England | 126 | 70.4 | 58.6–83.8 | Below GB | |
| England | 657 | 70.3 | 65.0–75.9 | Below GB | |
| England | 83 | 69.8 | 55.6–86.5 | Below GB | |
| Scotland | 18 | 69.5Fewer than 20 deaths | 41.2–109.9 | Interval includes GB | |
| England | 177 | 68.3 | 58.6–79.1 | Below GB | |
| England | 77 | 68.1 | 53.8–85.1 | Below GB | |
| England | 95 | 67.9 | 54.9–83.0 | Below GB | |
| England | 73 | 67.5 | 52.9–84.8 | Below GB | |
| England | 106 | 67.5 | 55.2–81.6 | Below GB | |
| England | 92 | 66.8 | 53.9–81.9 | Below GB | |
| England | 77 | 66.6 | 52.6–83.2 | Below GB | |
| Wales | 120 | 66.3 | 55.0–79.3 | Below GB | |
| England | 115 | 66.2 | 54.6–79.4 | Below GB | |
| England | 83 | 66.1 | 52.7–81.9 | Below GB | |
| England | 82 | 65.7 | 52.2–81.5 | Below GB | |
| England | 83 | 65.6 | 52.2–81.3 | Below GB | |
| England | 97 | 65.3 | 53.0–79.7 | Below GB | |
| England | 60 | 65.3 | 49.8–84.0 | Below GB | |
| England | 2 | 64.4Fewer than 20 deaths | 7.8–232.5 | Interval includes GB | |
| Wales | 107 | 64.3 | 52.7–77.7 | Below GB | |
| England | 166 | 63.8 | 54.4–74.3 | Below GB | |
| Wales | 159 | 63.4 | 53.9–74.1 | Below GB | |
| England | 149 | 63.1 | 53.4–74.1 | Below GB | |
| England | 237 | 62.8 | 55.1–71.3 | Below GB | |
| England | 58 | 62.4 | 47.4–80.7 | Below GB | |
| England | 54 | 62.2 | 46.7–81.2 | Below GB | |
| Scotland | 155 | 62.1 | 52.7–72.6 | Below GB | |
| Wales | 70 | 61.9 | 48.3–78.2 | Below GB | |
| England | 134 | 61.8 | 51.7–73.2 | Below GB | |
| England | 114 | 61.2 | 50.4–73.5 | Below GB | |
| Scotland | 106 | 60.1 | 49.2–72.6 | Below GB | |
| Wales | 37 | 59.6 | 42.0–82.2 | Below GB | |
| Scotland | 60 | 59.5 | 45.4–76.5 | Below GB | |
| Wales | 139 | 59.4 | 49.9–70.1 | Below GB | |
| England | 181 | 59.0 | 50.7–68.2 | Below GB | |
| England | 151 | 58.8 | 49.8–69.0 | Below GB | |
| Scotland | 76 | 58.4 | 46.0–73.1 | Below GB | |
| Scotland | 79 | 58.0 | 45.9–72.3 | Below GB | |
| England | 177 | 56.5 | 48.5–65.5 | Below GB | |
| England | 103 | 56.4 | 46.0–68.4 | Below GB | |
| England | 96 | 56.0 | 45.4–68.4 | Below GB | |
| England | 32 | 56.0 | 38.3–79.0 | Below GB | |
| Wales | 91 | 55.6 | 44.8–68.3 | Below GB | |
| Wales | 84 | 55.5 | 44.3–68.7 | Below GB | |
| England | 145 | 55.4 | 46.7–65.2 | Below GB | |
| Wales | 44 | 55.0 | 40.0–73.9 | Below GB | |
| Scotland | 20 | 54.2 | 33.1–83.8 | Below GB | |
| England | 51 | 53.0 | 39.5–69.7 | Below GB | |
| England | 131 | 52.5 | 43.9–62.3 | Below GB | |
| Scotland | 103 | 52.5 | 42.8–63.6 | Below GB | |
| Scotland | 76 | 52.4 | 41.3–65.6 | Below GB | |
| England | 83 | 52.2 | 41.6–64.7 | Below GB | |
| Wales | 49 | 51.8 | 38.3–68.4 | Below GB | |
| England | 112 | 50.4 | 41.5–60.6 | Below GB | |
| England | 64 | 49.8 | 38.3–63.6 | Below GB | |
| England | 37 | 48.8 | 34.3–67.2 | Below GB | |
| Scotland | 44 | 47.9 | 34.8–64.3 | Below GB | |
| England | 20 | 44.3 | 27.1–68.5 | Below GB | |
| Wales | 74 | 40.5 | 31.8–50.9 | Below GB | |
| England | 3 | 37.8Fewer than 20 deaths | 7.8–110.6 | Interval includes GB | |
| Scotland | 8 | 33.4Fewer than 20 deaths | 14.4–65.8 | Below GB |
No areas match. Clear the search or change the filter.
The interactive controls could not load. The table, charts and CSV downloads remain available.
How we calculated the comparisons
We extracted all 350 unitary and local authority areas in HSE’s July 2026 MESOAREA workbook. County totals and regional totals are excluded from the local comparison to avoid double-counting. The 350 local totals reconcile to 63,320 male and 11,831 female deaths for 1981–2024.
Expected deaths use Great Britain’s age-specific mortality rates. We use HSE’s published SMRs and confidence intervals unchanged, rather than constructing crude per-person rates. Men and women are assessed separately. An SMR of 200 represents twice the expected deaths under the relevant national benchmark, not a 200% personal probability of illness.
Rank eligibility: at least 20 deaths for the selected sex over 1981–2024. This editorial threshold reduces instability in the headline lists. It leaves 346 male and 243 female areas eligible. All 350 areas remain in the data; unranked areas are grey on the map. Our ranks within the eligible set can differ from HSE’s unfiltered ranks.
Uncertainty: the full-period intervals are HSE’s 95% confidence intervals. “Above GB” means the lower limit exceeds 100; “Below GB” means the upper limit is below 100; otherwise the interval includes 100. These are individual comparisons, without adjustment for testing many areas. The ordering of overlapping estimates should not be treated as a statistically proven difference between councils.
Trends: the local explorer uses the eight five-year periods supplied in tables 03–04, from 1985–1989 to 2020–2024. The headline period starts in 1981; summing the displayed five-year periods therefore does not reproduce its total. Recent-period ratios are shown descriptively, with small counts flagged. We do not treat a change in ratio as a change in absolute risk or claim that it is statistically significant.
Coverage: Great Britain includes England, Scotland and Wales. Northern Ireland is outside the HSE mortality dataset used here, so the map is not labelled as UK-wide. HSE’s harmonised council codes match all 350 Great Britain boundaries in the May 2024 ONS map. Residence at death may differ from place of exposure. Figures for 2024 are provisional.
This is a local exploration of published official statistics, not a new estimate of the amount of asbestos in buildings. For the broader national picture, see our UK asbestos statistics.
Recent-period comparison: the same minimum of 20 deaths is applied separately to 2020–2024, giving 198 eligible male and seven eligible female areas. These ranks use the recent ratios from HSE tables 03–04. Recent-period confidence intervals are not supplied in those trend tables, so no significance comparison is made. The explorer marks those intervals as unavailable; the full-period intervals are not reused for the recent period.
Download the data and use the findings
The tables, charts and methodology are available for reporting. Please keep the reporting period, geography and measure with any figures you use.
Writing about this research?
Please credit Asbestos Awareness Course and link to this study so readers can explore the figures and check the methodology.
Analysis by Asbestos Awareness Course, based on HSE mesothelioma mortality statistics, July 2026 release. Mesothelioma deaths by area: Britain’s asbestos legacy.
Underlying official data retains its original licence and attribution requirements. Please identify our contribution as analysis of that data.
For a local breakdown or a question about the method, contact our team.
Sources and data links
Sources checked on 7 November 2026.
- HSE MESOAREA: mesothelioma deaths by geographical areaJuly 2026 release. Tables 01–02: deaths, SMRs and 95% confidence intervals for 1981–2024. Tables 03–04: five-year local trends. Latest year provisional.
- HSE geographical analysis and methodologyExplains standardisation, residence-based geography, industrial history, migration and boundary changes. Pages 3–8, 17–20 and the methodology annex.
- HSE mesothelioma statistics, 2026Background on the long latency of disease and past occupational exposure.
- ONS local authority boundaries, May 2024Generalised UK boundaries matched by official area code. Contains OS data © Crown copyright and database right 2026; ONS data © Crown copyright 2026.
- HSE published data tablesUsed to verify the latest release available on 7 November 2026.